Every day, thousands of Backblaze customers create and update files. These changes make their way into our system to be securely stored. Sometimes they are sent to us immediately, while other times the differentials are batched up into a job that runs at a scheduled time.
In this post, I’m sampling three points in our network where we take in a lot of ingress traffic off of the internet, and we’re going to explore some of the trends that we see.
Reading the ingress tea leaves
So, why do we care about ingress trends? In short, it helps us with capacity planning, and it also tells us a lot about how people use cloud storage. We often think of planning in longer terms—weeks, months, or years. Here I wanted to focus on some of the patterns that we see during a shorter period; for example, a single day or a significant date, like the end of the calendar month. There are some interesting patterns we see in our client behavior that keep us on our toes when we are performing capacity planning.
We currently have two product offerings that have different usage and traffic patterns:
- Backblaze B2 Cloud Storage: Ingress and egress, high variance in traffic levels throughout the day, hour, and at the start of month.
- Backblaze Computer Backup: Heavy ingress, with a small variance in traffic levels during the business day or weekday vs. weekend.
Since humans are using our system, we see very human quirks in our traffic profiles. For example, we humans like round numbers! We notice that a lot of backup jobs kick off at midnight local or UTC, or fire off at the top of the hour, or trigger on the first of the month. This means we see spikes of network traffic during these periods. Additionally, a lot of new content gets created during the day and then queued up to be uploaded to us in an overnight backup job.
Scope and terms
Today we’re going to look at ingress traffic, which means we’re monitoring uploads from both Backblaze Computer Backup and Backblaze B2 into our environment. We’ll save downloads, traffic coming out of Backblaze, for analysis in future posts.
One common term that you’ll see on our graphs is the 95th percentile. The 95th percentile number is a point where 95% of all measurements are under and only 5% are over. This is a very typical method to use for monitoring, billing, and trend analysis in the telecom industry. It maps to a standard bell curve, and tells you that you’re capturing the vast majority of usage for planning purposes.

In one of our monitoring systems, we are sampling and recording the utilization on our network links and computing a 95th percentile over a five minute period.
With these items defined, let’s get into the data with some charts!
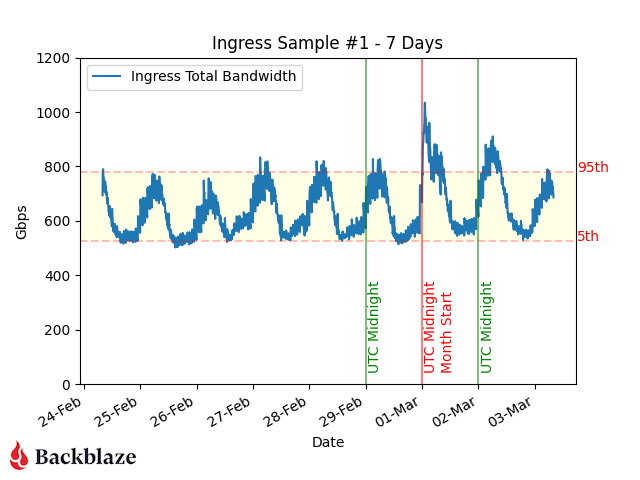
Sample 1: One-month trend
In this first sample, we see that the majority of our daily traffic falls within a nice range. What stands out here is the clock tick over from February to March, where we see a spike of ingress traffic that is outside the expected daily range.

Taking that same dataset, let’s take a closer look at the end of the month and zoom in on the calendar change into March.
Adding a vertical red line on 00:00 UTC where the month changes over, we see that there must be a lot of automated jobs that kick in right at the clock changeover into the new month.
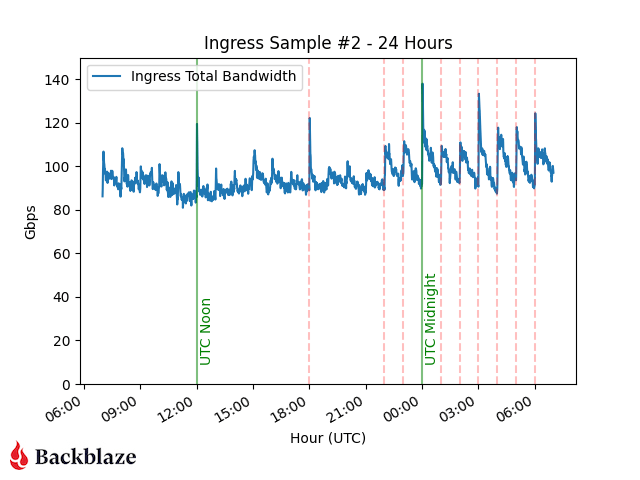
Sample 2: Top of the hour
Taking a look at another traffic sample from another point in our network, we see very distinct traffic patterns on the top of almost every hour.
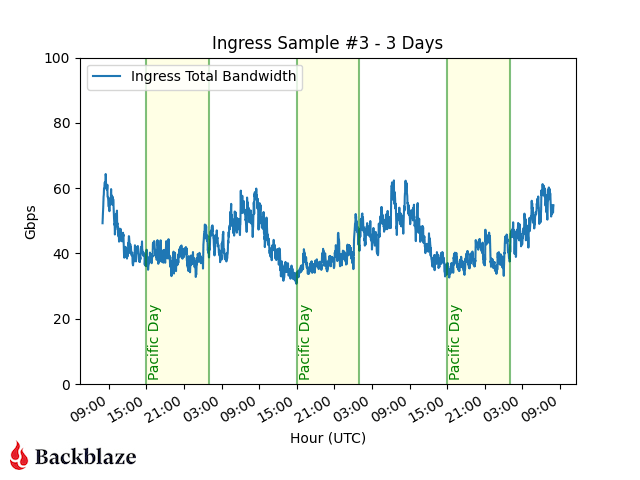
Sample 3: Pacific Time Zone working hours
Here’s a sample of traffic in our US-West region. During the business day on the West Coast, we see a lull in traffic, with a pickup after the business day is done. This makes sense to us as there are jobs that backup daily content that start to send traffic to us overnight.
What does this mean for you?
It’s very interesting to see the impact of humans in our network traffic and the patterns that emerge. Generally we humans create and modify things during the day, and we like to back them up over night for safekeeping. And we also like round numbers—people tend to send data at the top of the hour, midnight, or end of the month.
All of these elements are very important in how we, at Backblaze, capacity plan and balance traffic over transit links. We do a lot of work to make sure that no matter what time of day or day of the month, you can reliably get your data into Backblaze.
But, you might also look at this data and take away a meaningful conclusion: Much like choosing to go to the grocery store at 10:30 a.m. on a Tuesday versus fighting the after-work rush at 6:00 p.m., scheduling jobs on the 15, 30, or 45 minute mark or mid-month instead of at the end of the month would mean you’re up against less traffic, which is never a bad thing (and it also smooths out our ingress, which we wouldn’t be mad about either).
At the end of the day, however you choose to schedule your jobs works for us. We’re just glad we’re able to store and protect our customers’ data reliably and affordably, and we’re happy to pass along any tips and trips for a better, less congested, backup experience as well.
Thanks for reading, and stay tuned for more graphs and commentary on how we strive to build a reliable, scalable, and forward looking network to serve our customer’s needs.