As of December 31, 2023, we had 274,622 drives under management. Of that number, there were 4,400 boot drives and 270,222 data drives. This report will focus on our data drives. We will review the hard drive failure rates for 2023, compare those rates to previous years, and present the lifetime failure statistics for all the hard drive models active in our data center as of the end of 2023. Along the way we share our observations and insights on the data presented and, as always, we look forward to you doing the same in the comments section at the end of the post.
2023 Hard Drive Failure Rates
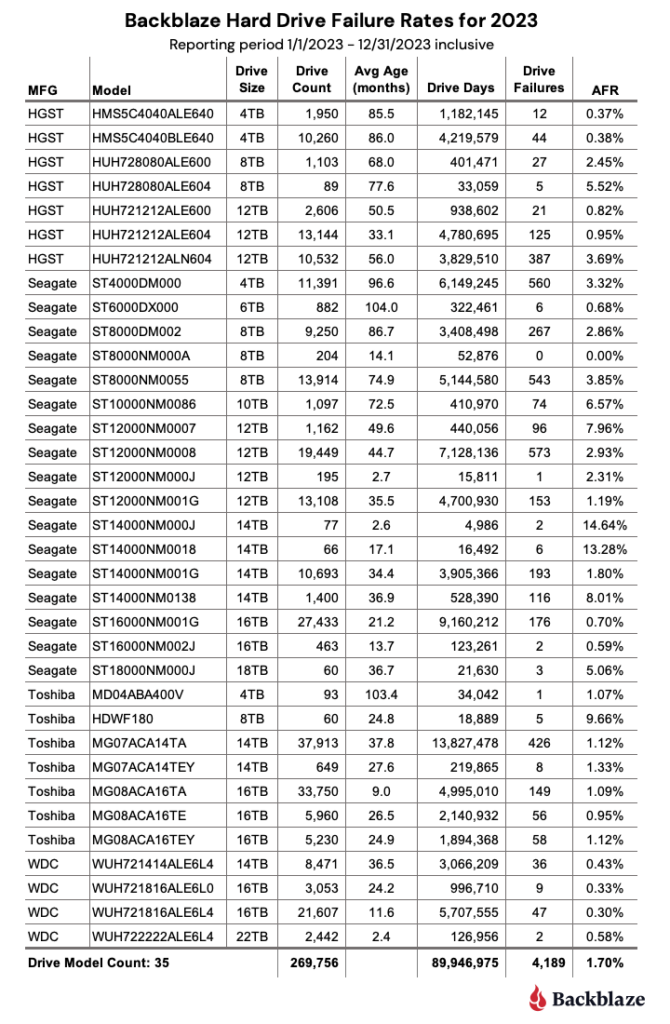
As of the end of 2023, Backblaze was monitoring 270,222 hard drives used to store data. For our evaluation, we removed 466 drives from consideration which we’ll discuss later on. This leaves us with 269,756 hard drives covering 35 drive models to analyze for this report. The table below shows the Annualized Failure Rates (AFRs) for 2023 for this collection of drives.
Notes and Observations
One zero for the year: In 2023, only one drive model had zero failures, the 8TB Seagate (model: ST8000NM000A). In fact, that drive model has had zero failures in our environment since we started deploying it in Q3 2022. That “zero” does come with some caveats: We have only 204 drives in service and the drive has a limited number of drive days (52,876), but zero failures over 18 months is a nice start.
Failures for the year: There were 4,189 drives which failed in 2023. Doing a little math, over the last year on average, we replaced a failed drive every two hours and five minutes. If we limit hours worked to 40 per week, then we replaced a failed drive every 30 minutes.
More drive models: In 2023, we added six drive models to the list while retiring zero, giving us a total of 35 different models we are tracking.
Two of the models have been in our environment for a while but finally reached 60 drives in production by the end of 2023.
- Toshiba 8TB, model HDWF180: 60 drives.
- Seagate 18TB, model ST18000NM000J: 60 drives.
Four of the models were new to our production environment and have 60 or more drives in production by the end of 2023.
- Seagate 12TB, model ST12000NM000J: 195 drives.
- Seagate 14TB, model ST14000NM000J: 77 drives.
- Seagate 14TB, model ST14000NM0018: 66 drives.
- WDC 22TB, model WUH722222ALE6L4: 2,442 drives.
The drives for the three Seagate models are used to replace failed 12TB and 14TB drives. The 22TB WDC drives are a new model added primarily as two new Backblaze Vaults of 1,200 drives each.
Mixing and Matching Drive Models
There was a time when we purchased extra drives of a given model to have on hand so we could replace a failed drive with the same drive model. For example, if we needed 1,200 drives for a Backblaze Vault, we’d buy 1,300 to get 100 spares. Over time, we tested combinations of different drive models to ensure there was no impact on throughput and performance. This allowed us to purchase drives as needed, like the Seagate drives noted previously. This saved us the cost of buying drives just to have them hanging around for months or years waiting for the same drive model to fail.
Drives Not Included in This Review
We noted earlier there were 466 drives we removed from consideration in this review. These drives fall into three categories.
- Testing: These are drives of a given model that we monitor and collect Drive Stats data on, but are in the process of being qualified as production drives. For example, in Q4 there were four 20TB Toshiba drives being evaluated.
- Hot Drives: These are drives that were exposed to high temperatures while in operation. We have removed them from this review, but are following them separately to learn more about how well drives take the heat. We covered this topic in depth in our Q3 2023 Drive Stats Report.
- Less than 60 drives: This is a holdover from when we used a single storage server of 60 drives to store a blob of data sent to us. Today we divide that same blob across 20 servers, i.e. a Backblaze Vault, dramatically improving the durability of the data. For 2024 we are going to review the 60 drive criteria and most likely replace this standard with a minimum number of drive days in a given period of time to be part of the review.
Regardless, in the Q4 2023 Drive Stats data you will find these 466 drives along with the data for the 269,756 drives used in the review.
Comparing Drive Stats for 2021, 2022, and 2023
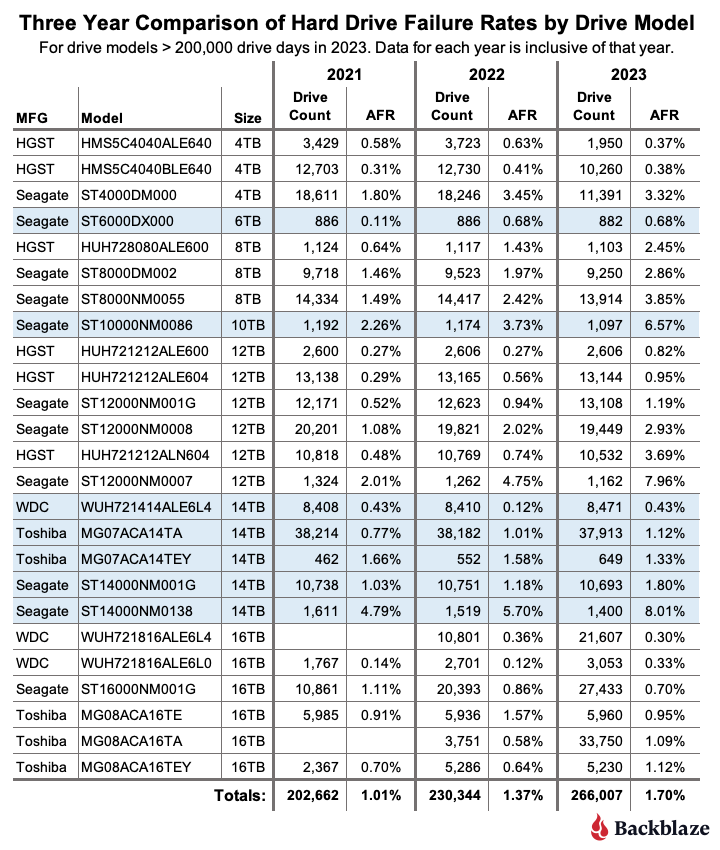
The table below compares the AFR for each of the last three years. The table includes just those drive models which had over 200,000 drive days during 2023. The data for each year is inclusive of that year only for the operational drive models present at the end of each year. The table is sorted by drive size and then AFR.
Notes and Observations
What’s missing?: As noted, a drive model required 200,000 drive days or more in 2023 to make the list. Drives like the 22TB WDC model with 126,956 drive days and the 8TB Seagate with zero failures, but only 52,876 drive days didn’t qualify. Why 200,000? Each quarter we use 50,000 drive days as the minimum number to qualify as statistically relevant. It’s not a perfect metric, but it minimizes the volatility sometimes associated with drive models with a lower number of drive days.
The 2023 AFR was up: The AFR for all drives models listed was 1.70% in 2023. This compares to 1.37% in 2022 and 1.01% in 2021. Throughout 2023 we have seen the AFR rise as the average age of the drive fleet has increased. There are currently nine drive models with an average age of six years or more. The nine models make up nearly 20% of the drives in production. Since Q2, we have accelerated the migration from older drive models, typically 4TB in size, to new drive models, typically 16TB in size. This program will continue throughout 2024 and beyond.
Annualized Failure Rates vs. Drive Size
Now, let’s dig into the numbers to see what else we can learn. We’ll start by looking at the quarterly AFRs by drive size over the last three years.
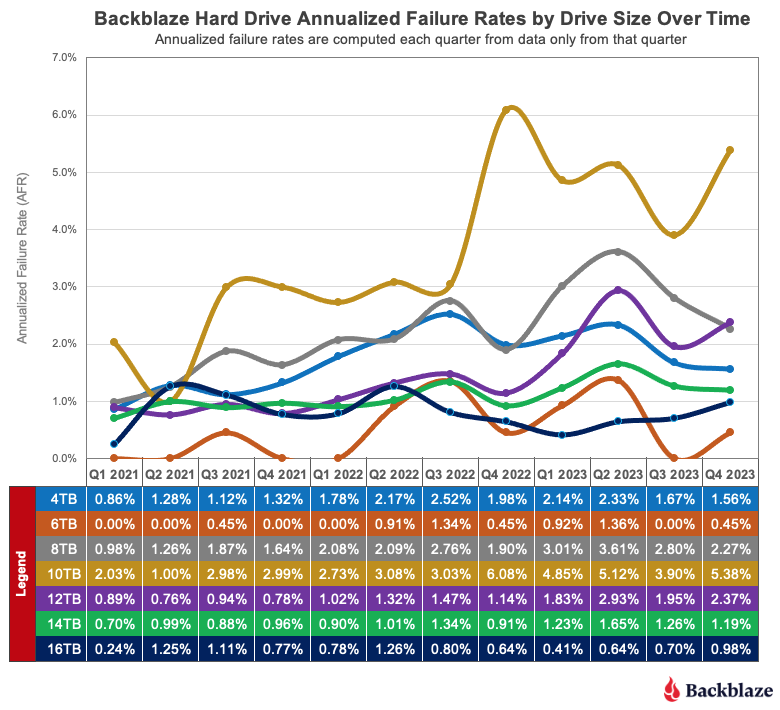
To start, the AFR for 10TB drives (gold line) are obviously increasing, as are the 8TB drives (gray line) and the 12TB drives (purple line). Each of these groups finished at an AFR of 2% or higher in Q4 2023 while starting from an AFR of about 1% in Q2 2021. On the other hand, the AFR for the 4TB drives (blue line) rose initially, peaking in 2022 and has decreased since. The remaining three drive sizes—6TB, 14TB, and 16TB—have oscillated around 1% AFR for the entire period.
Zooming out, we can look at the change in AFR by drive size on an annual basis. If we compare the annual AFR results for 2022 to 2023, we get the table below. The results for each year are based only on the data from that year.

At first glance it may seem odd that the AFR for 4TB drives is going down. Especially given the average age of each of the 4TB drives models is over six years and getting older. The reason is likely related to our focus in 2023 on migrating from 4TB drives to 16TB drives. In general we migrate the oldest drives first, that is those more likely to fail in the near future. This process of culling out the oldest drives appears to mitigate the expected rise in failure rates as a drive ages.
But, not all drive models play along. The 6TB Seagate drives are over 8.6 years old on average and, for 2023, have the lowest AFR for any drive size group potentially making a mockery of the age-is-related-to-failure theory, at least over the last year. Let’s see if that holds true for the lifetime failure rate of our drives.
Lifetime Hard Drive Stats
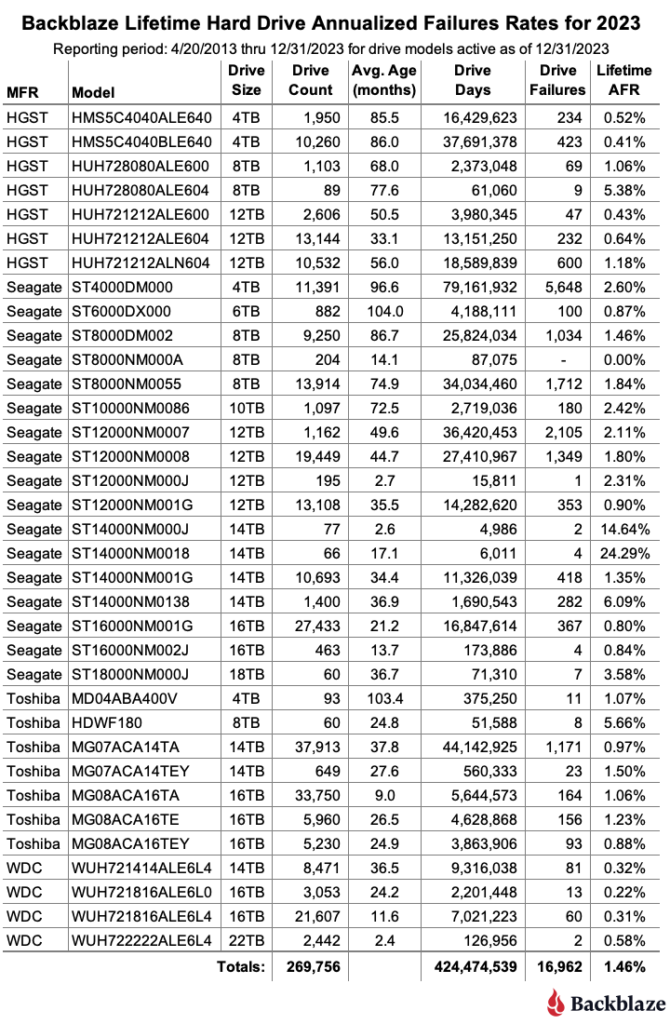
We evaluated 269,756 drives across 35 drive models for our lifetime AFR review. The table below summarizes the lifetime drive stats data from April 2013 through the end of Q4 2023.
The current lifetime AFR for all of the drives is 1.46%. This is up from the end of last year (Q4 2022) which was 1.39%. This makes sense given the quarterly rise in AFR over 2023 as documented earlier. This is also the highest the lifetime AFR has been since Q1 2021 (1.49%).
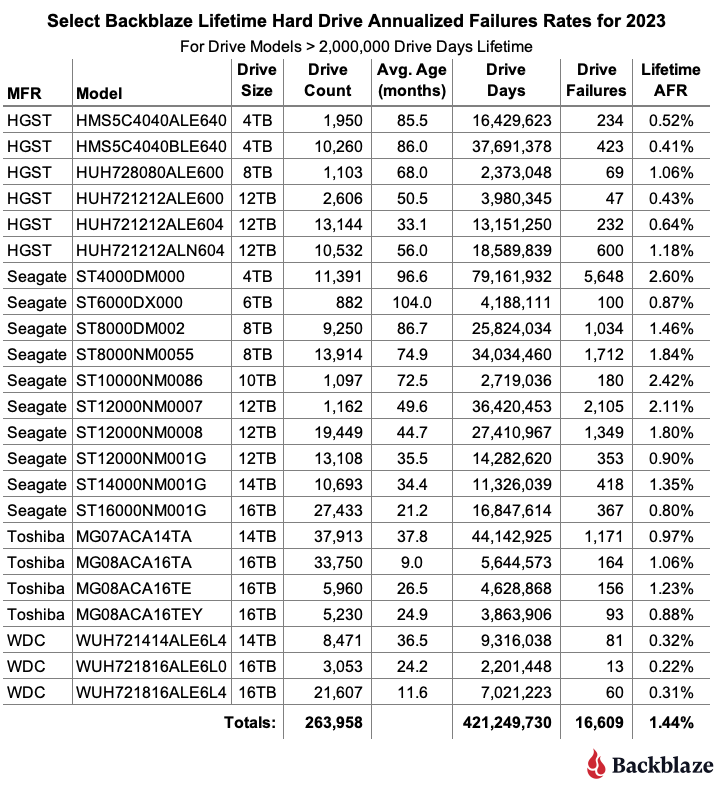
The table above contains all of the drive models active as of 12/31/2023. To declutter the list, we can remove those models which don’t have enough data to be statistically relevant. This does not mean the AFR shown above is incorrect, it just means we’d like to have more data to be confident about the failure rates we are listing. To that end, the table below only includes those drive models which have two million drive days or more over their lifetime, this gives us a manageable list of 23 drive models to review.
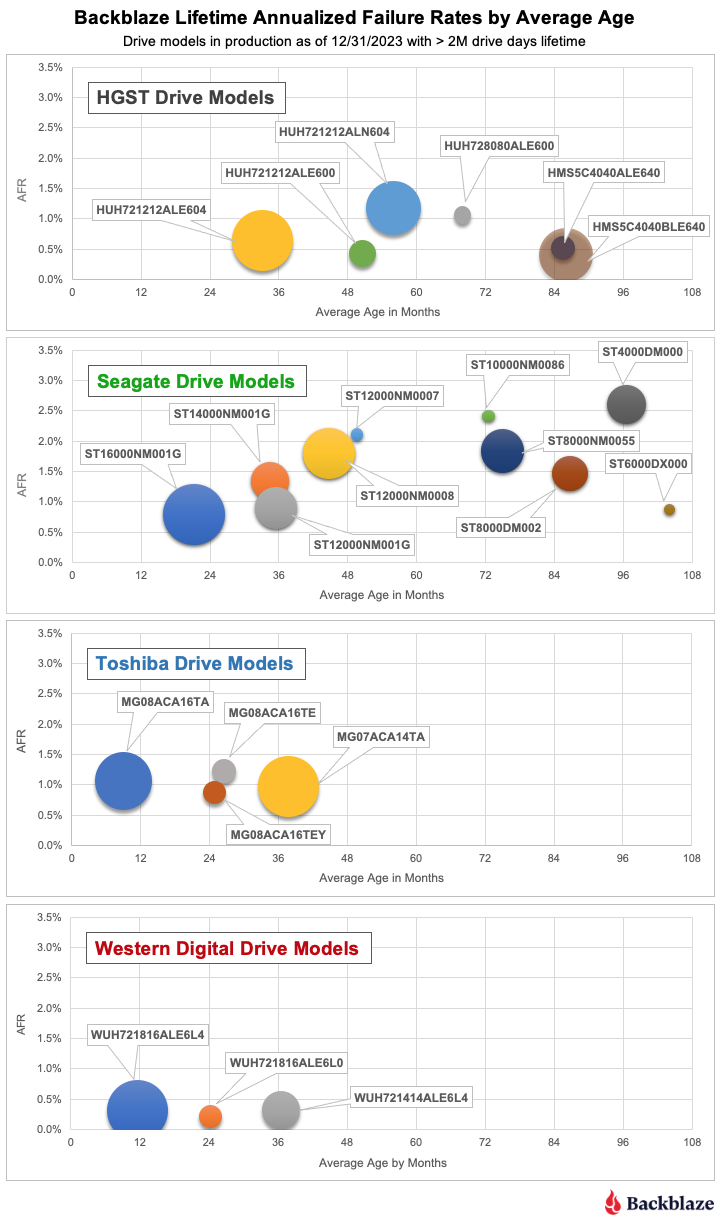
Using the table above we can compare the lifetime drive failure rates of different drive models. In the charts below, we group the drive models by manufacturer, and then plot the drive model AFR versus average age in months of each drive model. The relative size of each circle represents the number of drives in each cohort. The horizontal and vertical scales for each manufacturer chart are the same.
Notes and Observations
Drive migration: When selecting drive models to migrate we could just replace the oldest drive models first. In this case, the 6TB Seagate drives. Given there are only 882 drives—that’s less than one Backblaze Vault—the impact on failure rates would be minimal. That aside, the chart makes it clear that we should continue to migrate our 4TB drives as we discussed in our recent post on which drives reside in which storage servers. As that post notes, there are other factors, such as server age, server size (45 vs. 60 drives), and server failure rates which help guide our decisions.
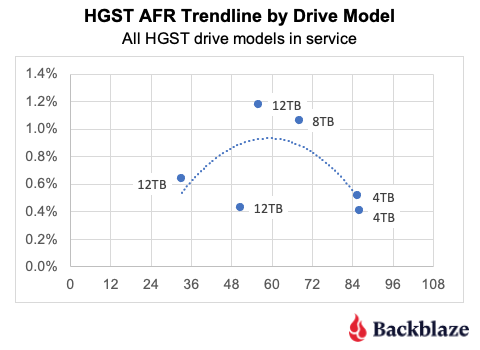
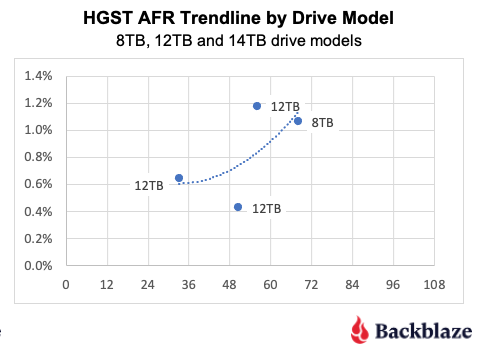
HGST: The chart on the left below shows the AFR trendline (second order polynomial) for all of our HGST models. It does not appear that drive failure consistently increases with age. The chart on the right shows the same data with the HGST 4TB drive models removed. The results are more in line with what we’d expect, that drive failure increased over time. While the 4TB drives perform great, they don’t appear to be the AFR benchmark for newer/larger drives.
One other potential factor not explored here, is that beginning with the 8TB drive models, helium was used inside the drives and the drives were sealed. Prior to that they were air-cooled and not sealed. So did switching to helium inside a drive affect the failure profile of the HGST drives? Interesting question, but with the data we have on hand, I’m not sure we can answer it—or that it matters much anymore as helium is here to stay.
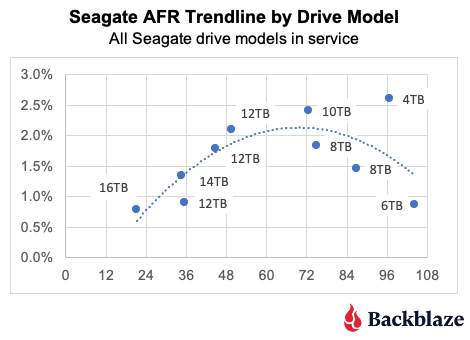
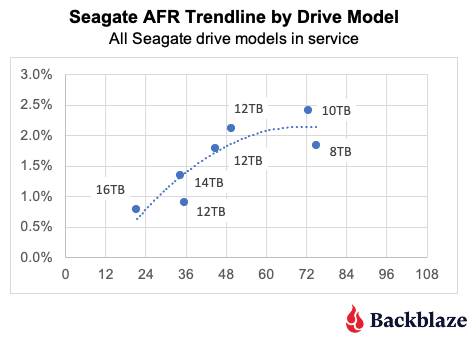
Seagate: The chart on the left below shows the AFR trendline (second order polynomial) for our Seagate models. As with the HGST models, it does not appear that drive failure continues to increase with age. For the chart on the right, we removed the drive models that were greater than seven years old (average age).
Interestingly, the trendline for the two charts is basically the same up to the six year point. If we attempt to project past that for the 8TB and 12TB drives there is no clear direction. Muddying things up even more is the fact that the three models we removed because they are older than seven years are all consumer drive models, while the remaining drive models are all enterprise drive models. Will that make a difference in the failure rates of the enterprise drive model when they get to seven or eight or even nine years of service? Stay tuned.
Toshiba and WDC: As for the Toshia and WDC drive models, there is a little over three years worth of data and no discernible patterns have emerged. All of the drives from each of these manufacturers are performing well to date.
Drive Failure and Drive Migration
One thing we’ve seen above is that drive failure projections are typically drive model dependent. But we don’t migrate drive models as a group, instead, we migrate all of the drives in a storage server or Backblaze Vault. The drives in a given server or Vault may not be the same model. How we choose which servers and Vaults to migrate will be covered in a future post, but for now we’ll just say that drive failure isn’t everything.
The Hard Drive Stats Data
The complete data set used to create the tables and charts in this report is available on our Hard Drive Test Data page. You can download and use this data for free for your own purpose. All we ask are three things: 1) you cite Backblaze as the source if you use the data, 2) you accept that you are solely responsible for how you use the data, and 3) you do not sell this data itself to anyone; it is free.
Good luck, and let us know if you find anything interesting.


