When you’re operating a data storage platform at exabyte scale, even small inefficiencies become big problems. With billions of files flowing through our systems, performance isn’t something we think about after the fact—it’s something we constantly chase, measure, and optimize.
But before you can improve cloud performance, you have to know where to look. When we were working on improving small file uploads, I was tasked with taking a closer look at our file upload pipeline to see if we could make it faster.
The path from that general idea to hitting a clear performance goal taught me a lot—not just about our systems, but about how to approach performance work in a principled, strategic way. Here’s how it unfolded, and what you can apply to your own environment.
Step one: Define the problem
The initial ask from our Product team was pretty familiar: “Can we make uploads faster?” It’s a fair question, but not a very actionable one. So we worked with our Product team to define our success criteria. Here are some of the questions we asked to get to specific, actionable goals:
“What do we mean by faster? Do we want to improve latency or throughput?”
“Do we want to improve all uploads? Just big files? Just small files?
“What qualifies as a small upload?”
After some back and forth, we landed on a clear, measurable target: Process file uploads of 1MB or less via our B2 API in under 40 milliseconds. That specificity made a huge difference:
- With a goal of 40 milliseconds, we had a stopping point. We would know when we’d done enough.
- We had a bar to measure against and a way to identify what was worth optimizing. If something took two milliseconds, we could leave it alone. If it took 30, it became the focus.
- We could scope effort. There’s a big difference between getting something under 40 milliseconds versus 200.
Step two: Use the right tools for the job if you possibly can
Analyzing performance without proper tooling means doing a lot of heavy lifting by hand. We had to drop custom instrumentation throughout the stack, create metric-collecting objects, and pass them all the way down the call stack so we could get timing data from different parts of the upload path.
The upload flow touches more than 20 storage pods and services, so we also built a lightweight sampling system to keep from flooding our metrics pipeline. The data went into an open-source search and analytics suite, and from there we built dashboards to try to make sense of it all.
It was time-consuming. Painfully so. But it worked.
I could now compare fast and slow uploads, identify patterns, and—most importantly—see where time was actually being spent. That’s how we discovered that fsync was dominating our performance profile, captured in the screenshot below. We measured each sub-operation that comprises our drive write operations, and grouped them by the total time they took to complete. You can see the process fsync sub-operation dominates in every group. Removing or optimizing around it offered a 10x speedup. But it took weeks of manual effort to get to that insight.

Enter: Tracing at scale
Eventually, we brought in more powerful tooling, including an open source distributed tracing system. It was a game changer.
What used to take dozens of lines of code and a lot of custom wiring now took a single annotation. More importantly, it gave us something we couldn’t get otherwise: a way to see activity across services, systems, and pods—all in one view.
It allowed us to correlate events happening across different physical machines, trace performance end-to-end, and understand the impact of specific changes in real time.
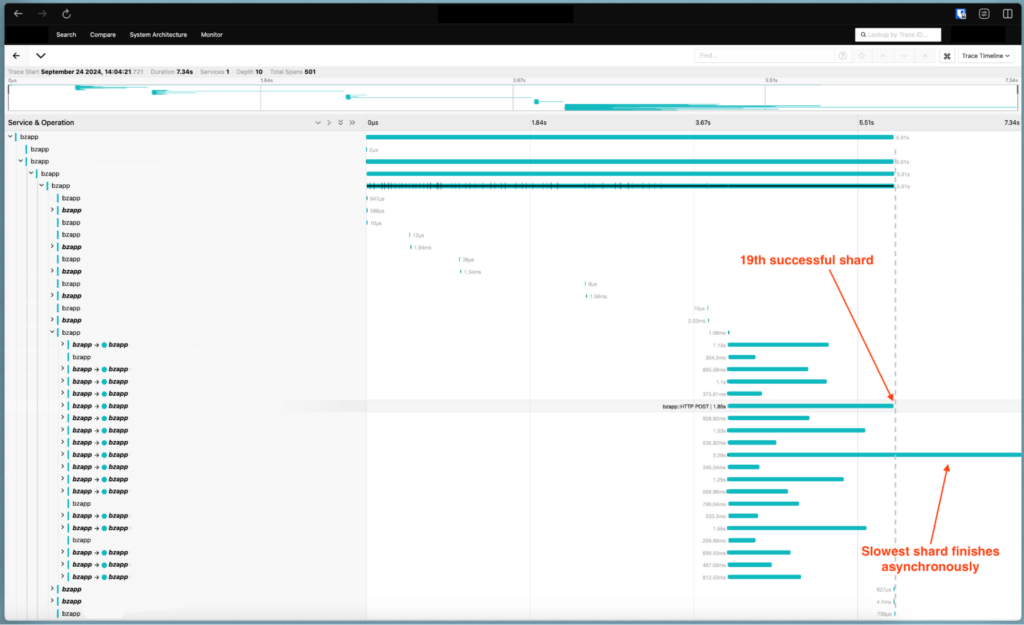
At one point, we were debating whether a particular optimization would get us across the finish line. This optimization allows the slowest shard to store asynchronously if and only if all others had been successfully and durably stored. This prevents a single slow shard from slowing down the entire upload. Thanks to the new tooling, we didn’t have to guess—we could see that once we flipped the switch, we’d hit our 40ms goal (and it would help all other uploads as well, not just small uploads). That let us focus on getting that one feature ready for production, confident that it would move the needle.
Step three: Optimize with intent
One of the biggest lessons I learned through this process is that you can spend weeks optimizing the wrong thing if you’re not careful. That’s why measurement has to come first.
Don’t guess. Instrument. Don’t tweak randomly. Set a baseline and track deltas. Performance work is iterative. You’ll fix one bottleneck, only to reveal the next one lurking beneath it. That’s the job.
In hindsight, one of the smartest things we did was setting a clear performance goal at the start of the project. It didn’t just help us focus—it told us when we were done. You can optimize forever. Knowing when to stop is just as important as knowing where to begin.
Step four: Tool up for the future
The tracing tool has made life a lot easier, but it’s not the only tool we use. Our analytics suite still plays a big role when we want to analyze aggregate data, or need the flexibility to slice and dice data. The two complement each other nicely.
There’s no one-size-fits-all solution—it’s more like a toolbox. And like any good toolbox, it keeps growing with our needs.
Advice from the trenches
If you’re running distributed systems or chasing performance in your own stack, here’s what I’d suggest:
- Start with a clear goal. Know exactly what “faster” means, and write it down.
- Measure before you optimize. Otherwise, you’re flying blind.
- Pick the right tool for the job. Tracing, metrics, logs—they all have their place.
- Don’t wait to build your tools. Invest in observability early.
- Know when to stop. The ROI of performance work diminishes fast if you’re not careful.
And maybe give your helper methods better names than DoSomeWork. Or don’t. It makes the code reviews a little more entertaining.