
As of the end of Q1 2024, Backblaze was monitoring 283,851 hard drives and SSDs in our cloud storage servers located in our data centers around the world. We removed from this analysis 4,279 boot drives, consisting of 3,307 SSDs and 972 hard drives. This leaves us with 279,572 hard drives under management to examine for this report. We’ll review their annualized failure rates (AFRs) as of Q1 2024, and we’ll dig into the average age of drive failure by model, drive size, and more. Along the way, we’ll share our observations and insights on the data presented and, as always, we look forward to you doing the same in the comments section at the end of the post.
Hard Drive Failure Rates for Q1 2024
We analyzed the drive stats data of 279,572 hard drives. In this group we identified 275 individual drives which exceeded their manufacturer’s temperature specification at some point in their operational life. As such, these drives were removed from our AFR calculations.
The remaining 279,297 drives were divided into two groups. The primary group consists of the drive models which had at least 100 drives in operation as of the end of the quarter and accumulated over 10,000 drive days during the same quarter. This group consists of 278,656 drives grouped into 29 drive models. The secondary group contains the remaining 641 drives which did not meet the criteria noted. We will review the secondary group later in this post, but for the moment let’s focus on the primary group.
For Q1 2024, we analyzed 278,656 hard drives grouped into 29 drive models. The table below lists the AFRs of these drive models. The table is sorted by drive size then AFR, and grouped by drive size.


Notes and Observations on the Q1 2024 Drive Stats
- Downward AFR: The AFR for Q1 2024 was 1.41%. That’s down from Q4 2023 at 1.53%, and also down from one year ago (Q1 2023) at 1.54%. The continuing process of replacing older 4TB drives is a primary driver of this decrease as the Q1 2024 AFR (1.36%) for the 4TB drive cohort is down from a high of 2.33% in Q2 2023.
- A Few Good Zeroes: In Q1 2024, three drive models had zero failures:
- 16TB Seagate (model: ST16000NM002J)
- Q1 2024 drive days: 42,133
- Lifetime drive days: 216,019
- Lifetime AFR: 0.68%
- Lifetime confidence interval: 1.4%
- 8TB Seagate (model: ST8000NM000A)
- Q1 2024 drive days: 19,684
- Lifetime drive days: 106,759
- Lifetime AFR: 0.00%
- Lifetime confidence interval: 1.9%
- 6TB Seagate (model: ST6000DX000)
- Q1 2024 drive days: 80,262
- Lifetime drive days: 4,268,373
- Lifetime AFR: 0.86%
- Lifetime confidence interval: 0.3%
- 16TB Seagate (model: ST16000NM002J)
All three drives have a lifetime AFR of less than 1%, but in the case of the 8TB and 16TB drive models the confidence interval (95%) is still too high. While it is possible the two drives models will continue to perform well, we’d like to see the confidence interval below 1%, and preferably below 0.5%, before we can trust the lifetime AFR.
With a confidence interval of 0.3% the 6TB Seagate drives delivered another quarter of zero failures. At an average age of nine years, these drives continue to defy their age. They were purchased and installed at the same time back in 2015, and are members of the only 6TB Backblaze Vault still in operation.
- The End of the Line: The 4TB Toshiba (model: MD04ABA400V) are not in the Q1 2024 Drive Stats tables. This was not an oversight. The last of these drives became a migration target early in Q1 and their data was securely transferred to pristine 16TB Toshiba drives. They rivaled the 6TB Seagate drives in age and AFR, but their number was up and it was time to go.
The Secondary Group
As noted previously, we divided the drive models into two groups, primary and secondary, with drive count (>100) and drive days (>10,000) being the metrics used to divide the groups. The secondary group has a total of 641 drives spread across 27 drive models. Below is a table of those drive models.

The secondary group is mostly made up of drive models which are replacement drives or migration candidates. Regardless, the lack of observations (drive days) over the observation period is too low to have any certainty about the calculated AFR.
From time to time, a secondary drive model will move into the primary group. For example, the 14TB Seagate (model: ST14000NM000J) will most likely have over 100 drives and 10,000 drive days in Q2. The reverse is also possible, especially as we continue to migrate our 4TB drive models.
Why Have a Secondary Group?
In practice we’ve always had two groups; we just didn’t name them. Previously, we would eliminate from the quarterly, annual, and lifetime AFR charts drive models which did not have at least 45 drives, then we upped that to 60 drives. This was okay, but we realized that we needed to also set a minimum number of drive days over the analysis period to improve our confidence in the AFRs we calculated. To that end, we have set the following thresholds for drive models to be in the primary group.
| Review Period | Drive Count per Model | Drive Days per Model |
|---|---|---|
| Quarterly | >100 drives | >10,000 drive days |
| Annual | >250 drives | >50,000 drives days |
| Lifetime | >500 drives | >100,000 drive days |
We will evaluate these metrics as we go along and change them if needed. The goal is to continue to provide AFRs that we are confident are an accurate reflection of the drives in our environment.
The Average Age of Drive Failure Redux
In Q1 2023 Drive Stats report, we took a look at the average age in which a drive fails. This review was inspired by the folks at Secure Data Recovery who calculated that based on their analysis of 2,007 failed drives, the average age at which they failed was 1,051 days or roughly 2 years and 10 months.
We applied the same approach to our 17,155 failed drives and were surprised when our average age of failure was only 2 years and 6 months. Then we realized that many of the drive models that were still in use were older (much older) than the average, and surely when some number of them failed, it would affect the average age of failure for a given drive model.
To account for this realization, we considered only those drive models that are no longer active in our production environment. We call this collection retired drive models as these are drives that can no longer age or fail. When we reviewed the average age of this retired group of drives, the average age of failure was 2 years and 7 months. Unexpected, yes, but we decided we needed more data before reaching any conclusions.
So, here we are a year later to see if the average age of drive failure we computed in Q1 2023 has changed. Let’s dig in.
As before we recorded the date, serial_number, model, drive_capacity, failure, and SMART 9 raw value for all of the failed drives we have in the Drive Stats dataset back to April 2013. The SMART 9 raw value gives us the number of hours the drive was in operation. Then we removed boot drives and drives with incomplete data, that is some of the values were missing or wildly inaccurate. This left us with 17,155 failed drives as of Q1 2023.
Over this past year, Q2 2023 through Q1 2024, we recorded an additional 4,406 failed drives. There were 173 drives which were either boot drives or had incomplete data, leaving us with 4,233 drives to add to the 17,155 failed drives previous, totalling 21,388 failed drives to evaluate.
When we compare Q1 2023 to Q1 2024 we get the table below.
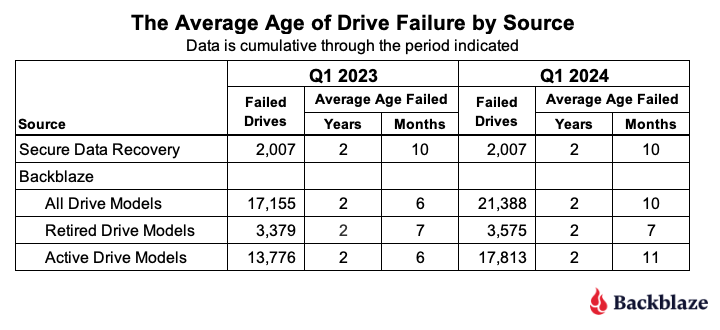
The average age of failure for all of the Backblaze drive models (2 years and 10 months) matches the Secure Data Recovery baseline. The question is, does that validate their number? We say, not yet. Why? Two primary reasons.
First, we only have two data points, so we don’t have much of a trend, that is we don’t know if the alignment is real or just temporary. Second, the average age of failure of the active drive models (that is, those in production) is now already higher (2 years and 11 months) than the Secure Data baseline. If that trend were to continue, then when the active drive models retire, they will likely increase the average age of failure of the drive models that are not in production.
That said, we can compare the numbers by drive size and drive model from Q1 2023 to Q1 2024 to see if we can gain any additional insights. Let’s start with the average age by drive size in the table below.

The most salient observation is that for every drive size that had active drive models (green), the average age of failure increased from Q1 2023 to Q1 2024. Given that the overall average age of failure increased over the last year, it is reasonable to expect that some of the active drive size cohorts would increase. With that in mind, let’s take a look at the changes by drive model over the same period.
Starting with the retired drive models, there were three drive models totalling 196 drives which moved from active to retired from Q1 2023 to Q1 2024. Still, the average age of failure for the retired drive cohort remained at 2 years 7 months, so we’ll spare you from looking at a chart with 39 drive models where over 90% of the data didn’t change Q1 2023 to Q1 2024.
On the other hand, the active drive models are a little more interesting, as we can see below.

In all but the two drive models (highlighted), the average age of failure for each drive model went up. In other words, active drive models are, on average, older when they fail, than one year ago. Remember, we are testing the average age of the drive failures, not the average age of the drive.
At this point, let’s review. The Secure Data Recovery folks checked 2,007 failed drives and determined their average age of failure was 2 years and 10 months. We are testing that assertion. At the moment, the average age of failure for the retired drive models (those no longer in operation in our environment) is 2 years and 7 months. This is still less than the Secure Data number. But, the drive models still in operation are now hitting an average of 2 years and 10 months, suggesting that once these drive models are removed from service, the average age of failure for the retired drive models will increase.
Based on all of this, we think the average age of failure for our retired drive models will eventually exceed 2 years and 10 months. Further, we predict that the average age of failure will reach closer to 4 years for the retired drive models once our 4TB drive models are removed from service.
Annualized Failures Rates for Manufacturers
As we noted at the beginning of this report, the quarterly AFR for Q1 2024 was 1.41%. Each of the four manufacturers we track contributed to the overall AFR as shown in the chart below.
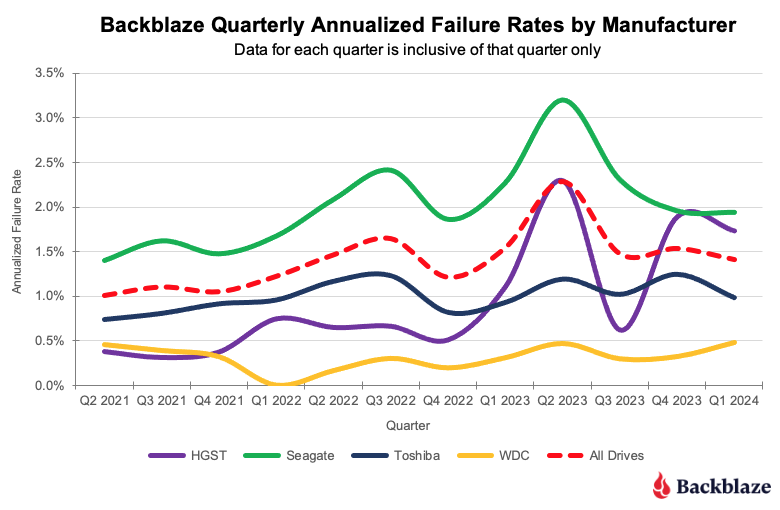
As you can see, the overall AFR for all drives peaked in Q3 2023 and is dropping. This is mostly due to the retirement of older 4TB drives that are further along the bathtub curve of drive failure. Interestingly, all of the remaining 4TB drives in use today are either Seagate or HGST models. Therefore, we expect the quarterly AFR will most likely continue to decrease for those two manufacturers as over the next year their 4TB drive models will be replaced.
Lifetime Hard Drive Failure Rates
As of the end of Q1 2024, we were tracking 279,572 operational hard drives. As noted earlier, we defined the minimum eligibility criteria of a drive model to be included in our analysis for quarterly, annual and lifetime reviews. To be considered for the lifetime review, a drive model was required to have 500 or more drives as of the end of Q1 2024 and have over 100,000 accumulated drive days during their lifetime. When we removed those drive models which did not meet the lifetime criteria, we had 277,910 drives grouped into 26 models remaining for analysis as shown in the tale below.
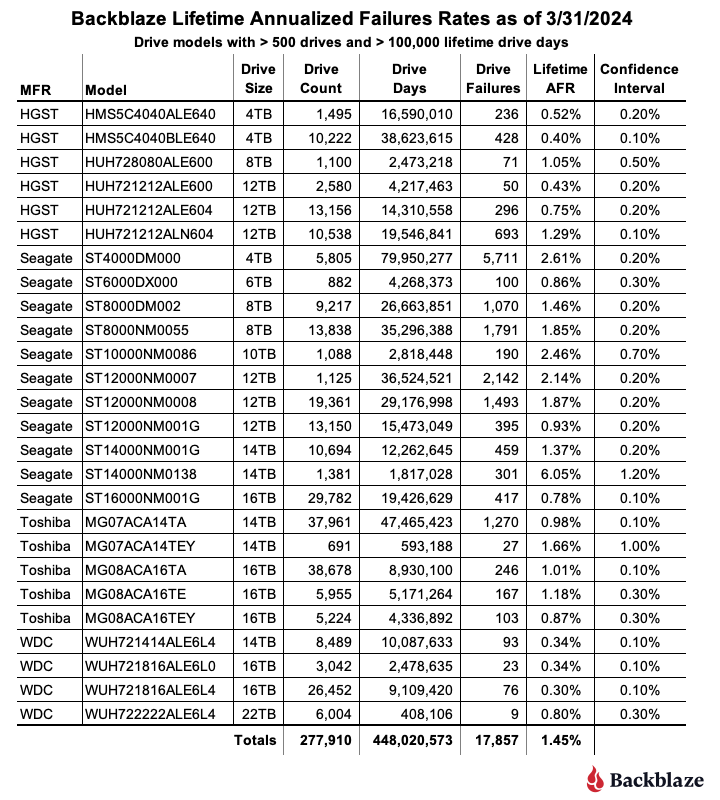
With three exceptions, the confidence interval for each drive model is 0.5% or less at 95% certainty. For the three exceptions: the 10TB Seagate, the 14TB Seagate, and 14TB Toshiba models, the occurrence of drive failure from quarter to quarter was too variable over their lifetime. This volatility has a negative effect on the confidence interval.
The combination of a low lifetime AFR and a small confidence interval is helpful in identifying the drive models which work well in our environment. These days we are interested mostly in the larger drives as replacements, migration targets, or new installations. Using the table above, let’s see if we can identify our best 12, 14, and 16TB performers. We’ll skip reviewing the 22TB drives as we only have one model.

The drive models are grouped by drive size, then sorted by their Lifetime AFR. Let’s take a look at each of those groups.
- 12TB drive models: The three 12TB HGST models are great performers, but are hard to find new. Also, Western Digital, who purchased the HGST drive business a while back, has started using their own model numbers of these drives, so it can be confusing. If you do find an original HGST make sure it is new as from our perspective buying a refurbished drive is not the same as buying a new.
- 14TB drive models: The first three models look to be solid—the WDC (WUH721414ALE6L4), Toshiba (MG07ACA14TA), and Seagate (ST14000NM001G). The remaining two drive models have mediocre lifetime AFRs and undesirable confidence intervals.
- 16TB drive models: Lots of choice here, with all six drive models performing well to this point, although the WDC models are the best of the best to date.
The Hard Drive Stats Data
It has now been eleven years since we began recording, storing and reporting the operational statistics of the hard drives and SSDs we use to store data in the Backblaze data storage cloud. We look at the telemetry data of the drives, including their SMART stats and other health related attributes. We do not read or otherwise examine the actual customer data stored.
Over the years, we have analyzed the data we have gathered and published our findings and insights from our analyses. For transparency, we also publish the data itself, known as the Drive Stats dataset. This dataset is open source and can be downloaded from our Drive Stats webpage.
You can download and use the Drive Stats dataset for free for your own purpose. All we ask are three things: 1) you cite Backblaze as the source if you use the data, 2) you accept that you are solely responsible for how you use the data, and 3) you do not sell this data to anyone; it is free.
Good luck and let us know if you find anything interesting.